 CONTENTS | ATLAS | GOOGLE EARTH
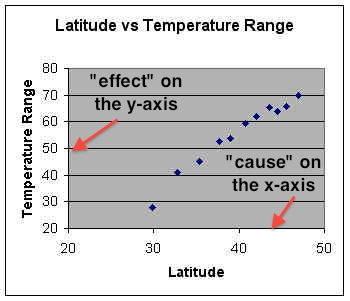
Graphs and StatisticsGraphsGraphs are a visual way to portray the relationship between a set of variables. Graphs can easily show the spatial pattern and discern a cause and effect relationship between earth phenomena. The variable plotted on the x-axis is the cause of the variable plotted on the y-axis. A good example of how graphs can be used for the analysis of relationships in physical geography is to plot the change in temperature range across latitudes. The Y-axis of Figure 1.28 has been scaled for temperature range and the X-axis for latitude. Note that temperature range appears to increase with latitude as one travels from the equator (0o) toward the pole (90o). Notice how the points seem to line up in a straight line. From the graph there appears to be a strong relationship between latitude and temperature range. From this graph we can say that (at least) latitude is a causal factor of temperature range.
StatisticsA statistic is a quantity that is computed from a sample of data. Statistics are used for analyzing and interpreting numerical information. Statistics are all around us and we all use them from time-to-time. Statistical methods refers to "the collection, presentation, analysis and interpretation of numerical data for the purpose of making more correct decisions" (Parl, B., 1967). Statistical methods are generally grouped into two categories descriptive statistics and statistical inference. Descriptive statistics attempt to simplify masses of data into a single number to communicate an existing condition or phenomena in the data. You will encounter two common descriptive statistics in this book. The mean (average) is the sum of the observations divided by the number of observations in the data set. The range is the difference between the highest and lowest value in a set of a data set. Choosing the right statistic, or statistics greatly influences our ability to accurately describe the spatial and temporal patterns of the natural world. Descriptive statistics can be deceiving. Imagine trying to compare the climate of two places to a friend who hasn't visited either. Let's say location A has a summer temperature of 80o F and a winter temp of 20o F. Location B has a summer temperature of 65o F and winter temperature of 45o F. Notice when we average the summer and winter temperatures for each their average temperature for the year is the same, 50o F. There appears to be no difference in climate between the two locations because both have the same average temperature. However, if we compute the seasonal range in temperature, 60o F for location A and 20o F for location B there appears to be a great deal of difference between the two. We should use both the average and temperature range to accurately describe climate. Table 1.1 Comparison of Average and Range |
|
Location A Summer temperature = 80o F Winter temperature = 20o F Average = 50o F Range = 60o F
|
Location B Summer temperature = 65o F Winter temperature = 45o F Average = 50o F Range = 20o F
|
Statistical inference "is a method concerned with the analysis of a subset of data leading to predictions (or inferences) about an entire set of data" (Goodman, 1996). An inference is an educated guess or estimate. One cannot make a definitive statement of what the correct answer is but couches the conclusion in a degree of uncertainty. Inferential statistics are employed to test the hypotheses we create about the relationship between phenomena. Correlation and regression analysis are two widely used statistical techniques. Correlation analysis attempts to express the degree to which variation in one variable is associated with the variation in another. Developing from correlation, regression enables us to estimate a mathematical statement which describes the relationship between two variables. These techniques are beyond the scope of this book.
|
|
For Citation: Ritter, Michael E. The Physical Environment: an Introduction to Physical Geography.
Date visited. https://www.thephysicalenvironment.com/
Please contact the thePitts (host) for inquiries, permissions, corrections or other feedback.
Lisa Pitts (host@thephysicalenvironment.com)
Help keep this site available by donating through PayPal.
![]()
This work is licensed under a Creative Commons Attribution-ShareAlike 4.0 International License..