Digging Deeper: Measuring, Visualizing, and Analyzing Wind Direction and Speed
There are two basic measurements taken of wind conditions, speed and direction. As noted in this chapter, wind speed is simply how fast the wind is blowing. Wind direction is described as where the wind comes from, not where it's going to. Let's dig deeper into how scientists measure and visualize wind speed and direction when analyzing weather.
Instrumentation
Wind speed is measured using an anemometer. A typical anemometer consists of 3 or 4 spinning "cups" mounted at equal angles to one another and then attached to a rod. The cups rotate proportional to the air flow past them. The number of revolutions in a unit of time is converted into a wind speed and recorded on a data logging device or read from dial. , The speed is reported in miles per hour, kilometers per hour, or knots.
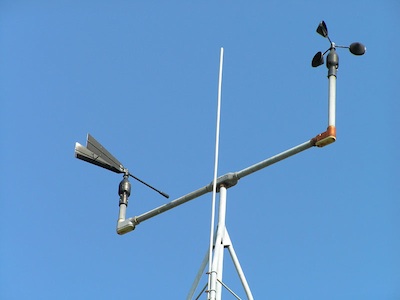
Figure 6-A Anemometer (right) and Wind Vane (left)
Courtesy NOAA Source
The Beaufort Scale was created in 1805 by Sir Francis Beaufort as a qualitative measure of wind condition effects on the sails of his ship. Thirteen classes, from 0 to 12, determined the number of sails to hoist. At 0 all sails would be raised with just enough wind to give steerage. At 6 half his sails would be up, and at 12 all sails would be down as conditions were to severe for canvas sails to withstand them. In 1906, the descriptions were changed to how seas behaved under different wind conditions. The Beaufort scale continues to be used by citizen weather spotters to estimate of conditions in the absence of instrumentation during severe weather.
Table 6-A Beaufort Scale
Courtesy NOAA: Source
A wind vane is a instrument to measure wind direction (on left in figure 6-A above). At its most simple configuration it is a pointed rod with a vane mounted perpendicular to the rod and attached to a vertical pole on which it rotates. The vane acts to orient the pointed end into the wind and hence points to the direction the wind comes from.
An aerovane is an instrument that can measure both wind direction and speed simultaneously. The aerovane sits atop a pole and rotates as the wind direction changes. The propeller spins faster as the wind speed increases. The spin of the propeller at the front spins faster as the wind speed increases. A signal is sent to a data logger where the orientation of the aerovane and spin of the propeller is converted into units of wind direction and speed. A vane on the tail orients the instrument into the wind.
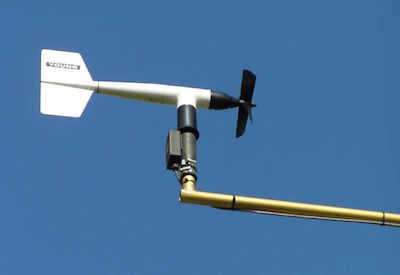
Figure 6-B Aerovane
Courtesy NOAA Source
Visualization and Analysis
Once wind data has been recorded it can be archived in print, or more likely digital form and symbolized on maps for further analysis.
Wind direction
Wind direction can be reported as a direction or in degrees. See table 6-B for the equivalency.
TABLE 6-B Wind direction degrees
Wind direction is symbolized on a weather map with a line radiating out from a point in the direction of the wind. The direction of the wind as symbolized in figure 6-C is northeast.
Figure 6-C Wind direction weather symbol
The prevailing wind the the direction that the wind comes from the most often. It can be determined by measuring the wind direction at many different times for a particular location and the calculating the percentage of times the wind comes from different directions. A wind rose is used to visualize the prevailing wind wind. The "rose" is constructed with bars or lines placed around a circle and drawn to a length proportional to the amount of time the wind blows from different directions. The prevailing wind shown in figure 6-D is from the south. Wind barbsor a color code can be added to show the average speed from a given direction.
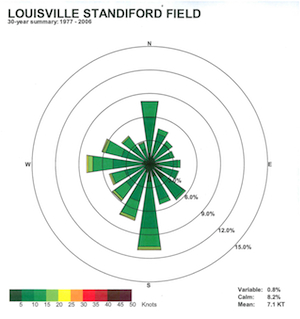
Figure 6-D A wind rose
Courtesy NOAA NWS (Source)
Wind speed
Wind speed is recorded in either miles per hour, kilometers per hour or knots. Small barbs or triangles attached to weather direction symbols are used to visualize wind speed on weather maps. Given that wind speed fluctuates so much over a short period of time, the symbols represent ranges of wind speed.

Table 6-E Wind speed
Courtesy Wikimedia
A "rule of thumb" for remembering the symbols is, half barb=5 knots, full barb=10 knots, flag=50 knots.
The patterns of wind speed and direction can be shown on weather maps, like the one in Figure 6-F. As described earlier in the chapter, the pressure gradient determines the speed of the wind. Note how the wind speed is greater where the isobars are closer together. The wind direction symbols show the typical clockwise movement around highs, and counterclockwise around lows. Local conditions at the time the data was collected may show some deviation from this generalization.
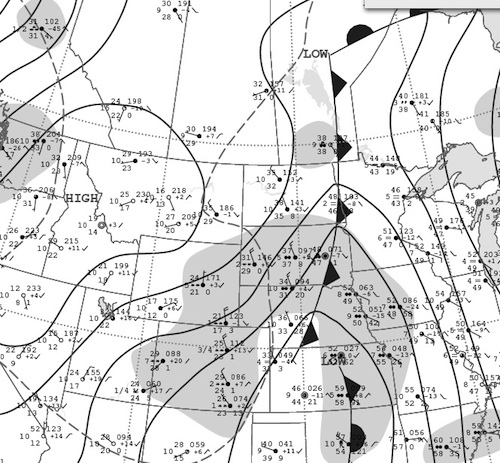
Figure 6-F Surface Weather Map
Courtesy NWS NOAA
